Economics & Statistics
30 January 2014
Economics & Statistics 30 January 2014 |
Quantitative
Marketing Research
(MTM - Module "Strategic Planning") - Winterterm
2013/14
|
Basic Material / Links:
additional books: Alternatively you might check (free) ebooks, for example at: http://bookboon.com/en
|
|
|
|
|
 |
 |
sess. |
date / time | Research Methods (Theory: Cooper et. al.) | Quantitative Methods (n) = chapter in Koop | Material / case (practical work on cases - see also table below) |
| 1-2 | Wed, 22 Jan 9.00 - 10.30 |
General
Introduction (Welcome.ppt)
-> ResMeth2014_Why-and-What.jpg |
Case study: Museum |
- Course
material (reader) - Case Study: surveys in the Kunsthalle Bremen (Paula
in Paris and others): |
| 3 | Wed, 22 Jan 10.45 - 11.30 |
Basic data management in Excel: |
Presentations of the team work tasks (in class) |
|
| 4-5 | Thur, 23 Jan 10.30 - 12.00 |
Part I: Introduction to Business Research
|
Preparing Data: |
|
| 6-7 | Thur, 23 Jan 13.00 - 14.30 |
|
Presentations of the team work tasks (homework case study I) | |
| 8-9 | Thur, 23 Jan 14.45 - 16.15 |
11. Measurement + |
|
|
| 10-11 | Fr, 24 Jan 9.00 - 10.30 |
13 Questionnaires and Instruments (selected aspects) |
|
|
| 12-13 | Fr, 24 Jan 10.45 - 12.15 |
14 Sampling |
Data Management in Excel: correlation and regression analysis. Excel file; XL_Exercises_Econometrics.xls Please download the XL-files by Koop (zip), we are going to use (some of) them in class. Today we will use especially: Forest.xls and HPrice.xls |
|
| 14-15 | Fr, 24 Jan 13.15 - 14.45 |
|
|
Example test, see also student website of Cooper and Schindler (there are MC test for every chapter). |
| 16-17 | Wed, 29 Jan 9.00 - 10.30 |
WEEK TWO: Your questions ... |
(6) First discussion of Multiple Regressions (scanned versions of chap 5 and 6 in Aulis); Causality, Specification | The test will contain the topics we discussed
in class: Planned topics: - The concepts discussed about chapter 1 and 2 of Cooper (pages/slides to be discussed) - Preparing Data: Measurement & Measurement Scales - chapters (3) and (4) of Koop about the concepts - you don't have to learn any formula (as you have the Statistics-QuickStudy at hand) - general questions about the concepts "describe", "explain". - computation and interpretation of regression results (simple reg.) |
| 18 | Wed, 29 Jan 10.45 - 11.30 |
Koop: "Analysis of Economic Data" Overview/Review chapters (1) to (3) (correlation) |
|
|
| 19-20 | Thur, 30 Jan 9.00 - 10.30 |
(4)
An introduction to simple regression
(6) Multiple Regression (scanned versions of chap 5 and 6 in Aulis); Causality, Specification |
||
| 21-22 | Thur, 30 Jan 10.45 - 12.15 |
Inference: Population and sample |
Teams present their PROPOSAL for the final presentations! The final presentation time should be around 10 minutes per student.You are requested to deliver a handout for all students |
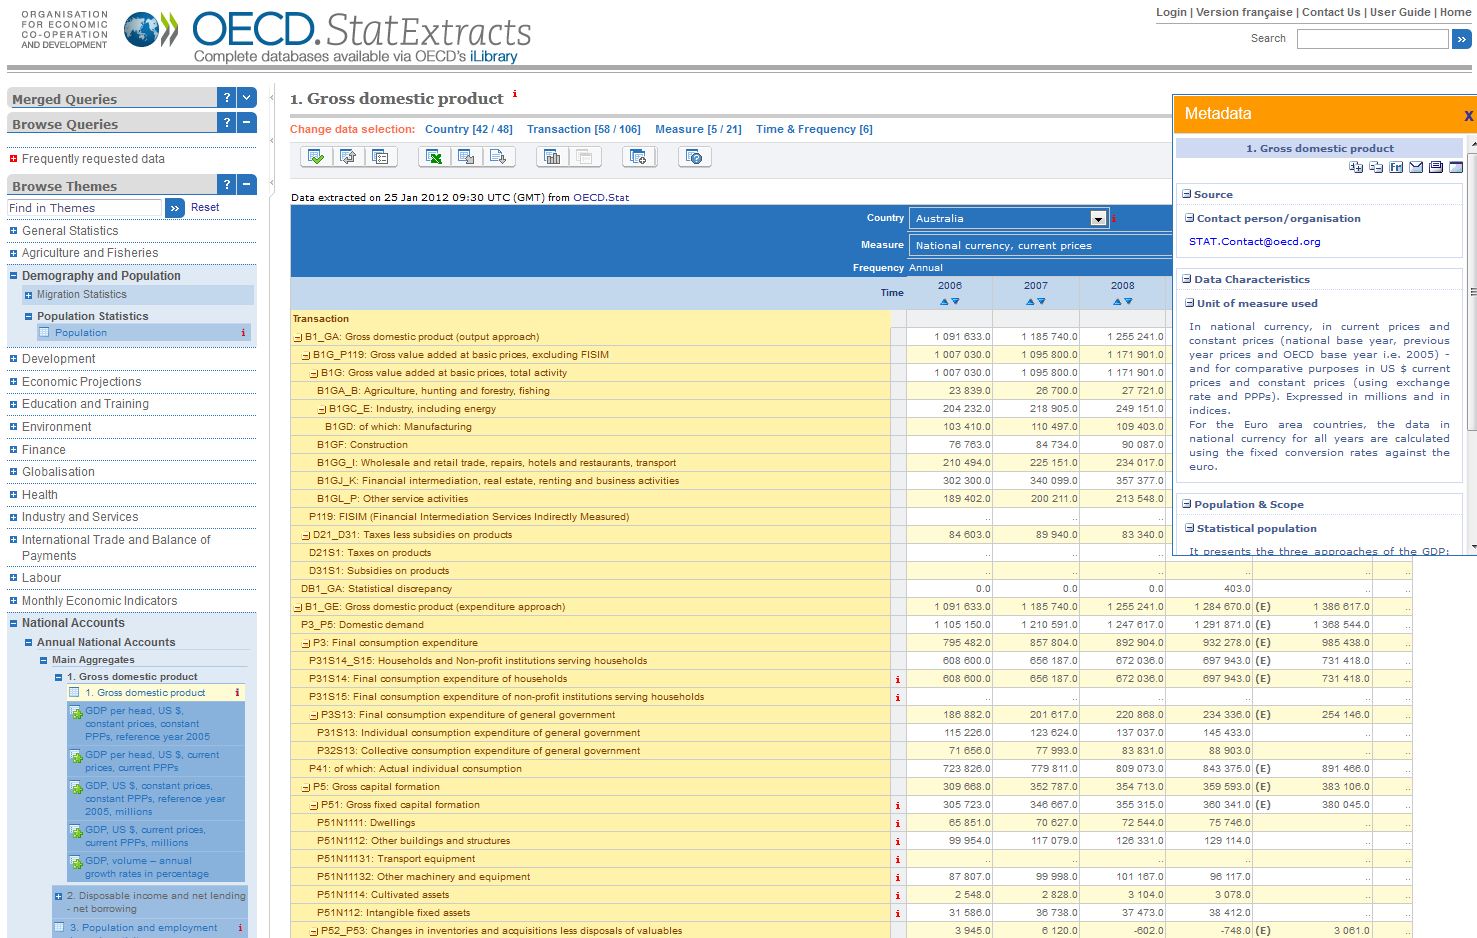
Basically the teams should find an own topic reflecting their own interest. But given that you obviously have a time problem due to (an) other presentation(s), here some examples: - Hedonic approaches (secondary data) - Potential Data Sources (just some suggestions):
|
| 23-24 | Thur, 30 Jan 13.15 - 14.45 |
chap 15a: Determining Sample Size (Random
- samples) chap 18. Hypothesis Testing |
(6) Multiple Regression (5) Statistical Aspects of Regression |
Central Limit Theorem (empty sheet used in class) Explaining House
Prices: XL-file: HPRICE_class.xls,
SPSS Label-File
|
| 25-26 | Fr, 31 Jan 9.00 - 10.30 |
tentative:
7. Secondary Data |
(7) Regression with dummy variables |
College Town: students'
results for simple linear analysis (see tasks in the below) -
hedonic regression for used cars Sample application:
Firm Foundations in Bremen: |
| 27-28 | Fr, 31 Jan 10.45 - 12.15 |
|
Presentations of the case
studies |
The presentation time should be around 10 minutes per student. You are requested to deliver a handout for all students To be found in a library database (for example Selected Resources - Faculty 1: International Business at TB Economics and Nautical Sciences at SUUB Bremen) or simply at Google Scholar. |
| 29-30 | Fr, 31 Jan 13.15 - 14.45 |
Review and conclusion / your questions Using SPSS additional information: |
Statistical
software: |
Statistical software:
Statistical software:
|
Teamwork: The Groups are asked
to prepare their tasks and present them in class.
| Date \ Group: | All |
1 |
2 |
3 |
| Homework to prepare for: | Names --> |
Jiaxi
(Sissi) Kamran Ahmed |
Fatali Shreekesh Kumar Vera |
Said
Saif Rahul Sarah |
1st session |
Discussion and brief presentation in class about project -> Memo | |||
for 2nd session 15 min. per team |
Data analysis: + socio-demographic characteristics of the respondents + describe the metric variables and analyse correlations that may make sense (including Inhabit_sqKm and distance) All Groups: define management dilemas and => Management / Research Questions for your topic ! |
... origin of the visitors and their socio-demographic characteristics for the different groups (question 26 ff in last colum) |
... Inducement to visit the exhibition (question 1) and their socio-demographic characteristics for the different groups |
... Reason to visit the exhibition (question 3) and their socio-demographic characteristics for the different groups (these are only the out-of-town visitors) |
NO Mandatory presentation but just an exercise for you. We'll discuss 1) in class briefly. So if someone volunteers to present it ... ;-) |
please read the papers and deliver a very brief
summary of the research question and results
in class: - do NOT spend more than 30-45 minutes to read the paper !!! (=the task is to understand the basic topic (research question and results), not the specific econometric model) - presentation should be 5-10 minutes |
2) A hedonic analysis of American collectable comic-book prices |
3) Cinema Demand in Germany | |
| for 30 January | "College Town": All groups should perform
|
(a) price / quantity | (b) advertising expenditures / quantity | (c) distance / quantity |
| for 30 January | -Material/resmeth/CollegeTownQuestion.doc, College_Town.xls (ii) the multiple regression, answering ... |
(h) what happens if FCI increases the rent by 50 and advertising
by 10 + general recommendations |
(g) what happens if an appartment building is located
5 miles further away than the average distance + general recommendations |
(f) what happens if FCI increases the advertising by 10
+ general recommendations |
![]() Additional Material:
Additional Material:
- Case study I (students' survey)
- Case study I: questionnaire,
homework: presentation
- Formula by P.
Schmidt (German - English)
- Central
Limit Theorem (empty
sheet)
- Suggestions for Presentation-Topics.doc
- Exam 2006
- Resit Exam 2006/07
- Examples for questions
Research Methods
- Questions about
estimations and tests
Remember that there are also (MC-) tests on the website
of the textbook ...
Case Study: Survey in the Kunsthalle Bremen
(Monet and Camille):
- Presentation van Gogh
- Questionnaire
- Data as Excel-file (7.5 Mb)
or zipped (1.9 Mb)
Links:
Statistics:
You are visitor number
![]()