Economics & Statistics
6 March 2020
Economics & Statistics 6 March 2020 |
Quantitative
Methods
(MGM - Module "Research and Communication")
- Summer term 2020
|
Basic Material / Links: Links to textbooks:
additional books: |
 |
 |
.
|
 |
 |
sess. |
date / time | Research Methods (Theory: chapter in Cooper et. al.) | Quantitative Methods (n) = chapter in Koop | Material / case (practical work on cases - see also table below) |
| 1 | day 1) Fri,
06 Mar 2020 9.00 - 10.30 |
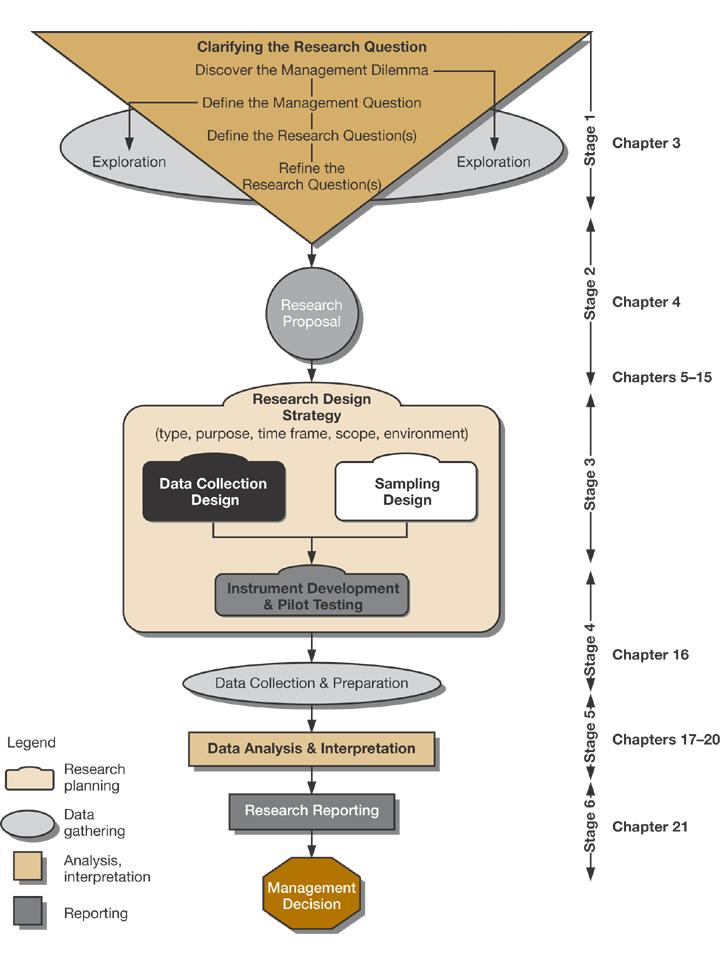
General Introduction
(Welcome.pptx) -> ResMeth_Why-and-What.jpg |
Preparing Data: |
|
| 2 | Fri, 06 Mar |
Part I: Introduction to Business Research
11. Measurement + |
12.45 short presentation of team work results |
- Case Study: surveys in the Kunsthalle Bremen (Paula
in Paris and others): |
| 3 | Fr, 06 Mar 13.15 - 14:45/15:00 |
11. Measurement + |
Preparing Data:
-> we'll use Excel, so if you have a computer |
Videos: data handling & analysis in XL (.swf):
Data management in Excel see Black, but also the introductory webpage at microsoft.com: "Introduction to Excel Starter") or www.excel-easy.com |
| 4 | day 2) Mon, 09 Mar 2020 9.00 - 10.30 |
3. Thinking Like a Researcher | Descriptive Statistics: Koop: "Analysis of Economic Data" |
Presentations of the team work tasks (homework case study Kunsthalle - see table below) |
| 5 | Mon, 09 Mar 10.45 - 12.15 |
Part I: Introduction to Business Research |
(3) (correlation) |
Data Management in Excel: correlation and regression analysis. Excel file Please download the XL-files by Koop (zip), we are going to use (some of) them in class. Today we will use especially: Forest.xls and HPrice.xls |
| 6 | Mon, 09 Mar 13.15 - 14:45/15:00 |
Your questions ... |
(4) An introduction to simple regression
|
Example
test, see also student
website of Cooper and Schindler |
| 7 | day 3) Tue, 10 Mar 2020 9.00 - 10.30 |
|
(4) Simple regression
|
|
| 8 | Tue,10 Mar |
(6) Multiple Regression
Preparation of case study
/ |
Basically the teams should find an own topic reflecting their own interest. The following topics are only examples: - Hedonic approaches (secondary data) |
|
| 9 | Tue,10 Mar 13.15 - 14:45/15:00 |
Inference: Population and sample |
(6) Multiple Regression
-> practicing exercises (=preparing for the midterm) |
The test will contain the topics we'll
discuss in class! |
| 10 | day 4) |
Midterm
test (30 minutes)
|
(5) Statistical Aspects of Regression (6) Multiple Regression |
College Town: students'
results for simple linear analysis (see tasks in the below) -
hedonic regression for used cars |
| 11 | Fr, 13 Mar 10.45 - 12.15 |
chap 17. Hypothesis Testing chap 16a: Describing Data |
Teams present their PROPOSAL
for the final presentations! The presentation
of the proposal can be short. It is important that the basic information
about the research question, the data
and the model (specification: dependent and independent variables)
are presented. |
Sample application:
Firm Foundations in Bremen: |
| 12 | Fr, 13 Mar 13.15 - 14:45/15:00 |
Inference: Population and sample chap 15a: Determining Sample Size (Random
- samples) |
(7) Regression with dummy variables To prepare your final presentation you can check the list in the Koop book (Look inside@bookstore) p 211/12 |
Central Limit Theorem (empty sheet used in class) Video about hypothesis tests (just a further hint, not necessarily exactly the same as we did in class) Explaining House
Prices: XL-file: HPRICE_class.xls,
SPSS Label-File |
| 13 | day 5) Mon, 30 Mar 2020 9.00 - 10.30 |
Teams' presentations The presentation time should be approx. 5-10 minutes per student ~> max 30 minutes per team. You are expected to deliver a handout for students. (The handout has to be a structured (Word-) file - I recommend to use the same numbered structure as in the presentation) chap 18. Hypothesis Testing |
Presentations of the case studies Please note the:
|
Don't forget to use - and quote correctly - academic literature, especially articles from academic journals. To be found in a library database (for example Selected
Resources - Faculty 1: International Business at TB
Economics and Nautical Sciences at SUUB
Bremen). |
| 14 | Mon, 30 Mar 10.45 - 12.15 |
tentative: 7. Secondary Data |
questions and outlook concerning: Time Series Analysis |
- Potential
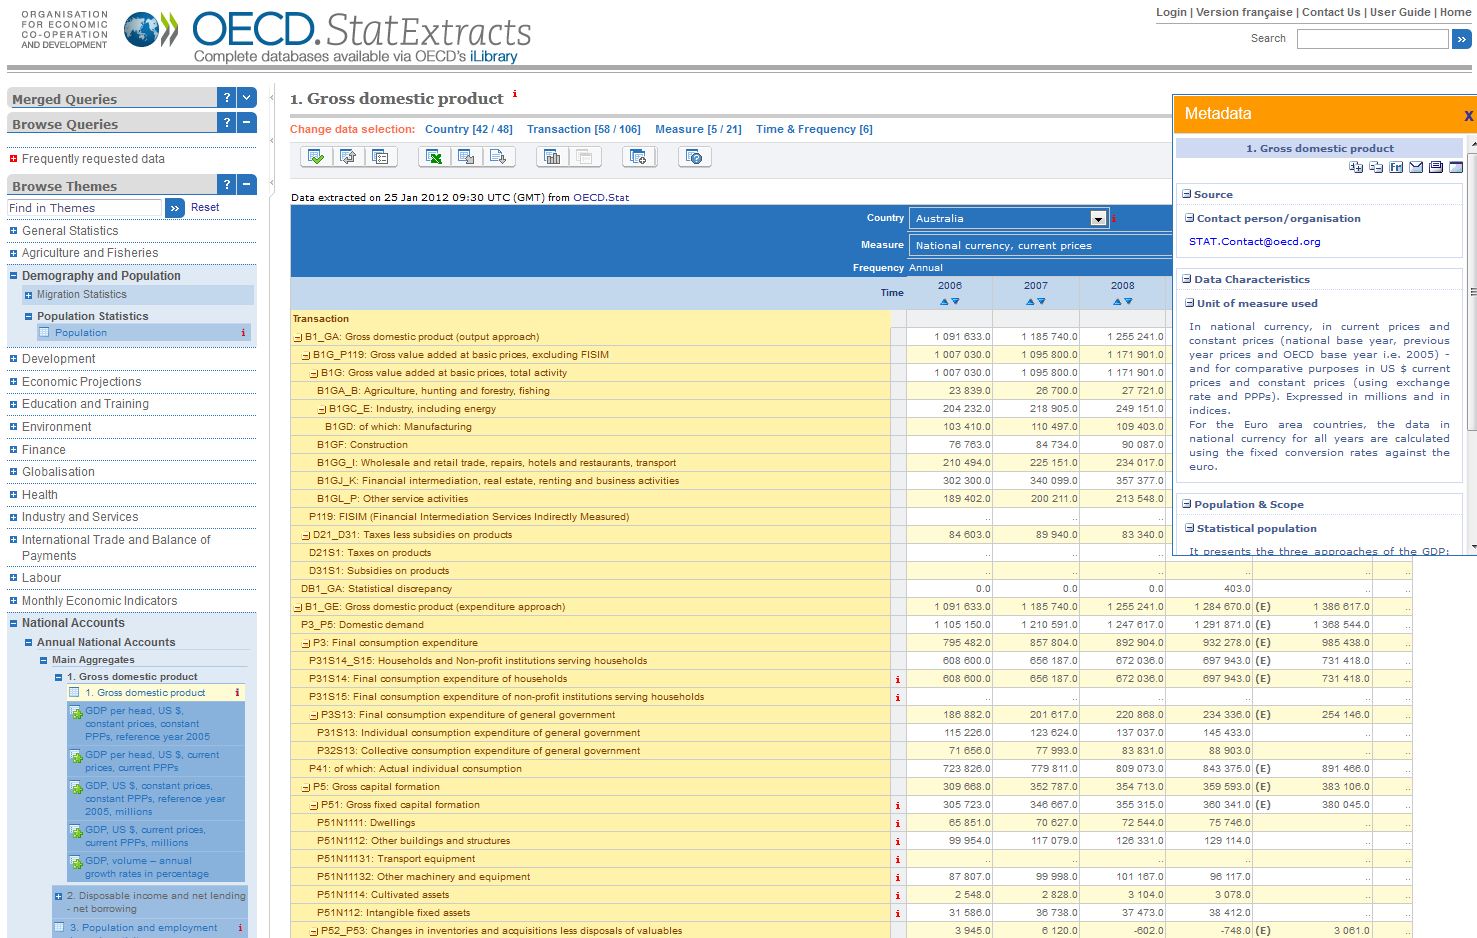
Data Sources (just some suggestions): IMF: - International Monetary Fund - World Economic Outlook - OECD: Statistics Portal, OECD.Stat Extracts (example for National Accounting) - The World Bank - www.worldbank.org - Data - WTO , Statistics database - CIA Factbook - The UC Atlas of Global Inequality by the University of California, Santa Cruz with the UC Atlas Database - United Nations Statistics Division Database with ComTrade Database - ATTAC international, Public Citizen - www.gapminder.org - ttp://freedomhouse.org - you can of course also use datasets provided by textbooks like Cooper/Schindler and Koop (SCS) |
| 15 | Mon, 30 Mar 13.15 - 14:45/15:00 |
Review and conclusion / your questions Using SPSS additional information: |
Statistical
software: |
Statistical software:
Statistical software:
|
| additional information: | Possibilities of the University Library: Econmics & Business Studies, Selected Resources - Faculty 1: International Business, Data Bases and RefWorks - EconLit |
RefWorks: |
2) A hedonic analysis of American collectable comic-book prices |
Teamwork: The Groups are asked to prepare their
tasks and present them in class. (The
teams have been build with respect to gender and nationality to assure mixed
international teams)
| Date \ Team: | All
team
number -> |
1 |
2 |
3 |
4 |
5 |
| homework to prepare to: | Names --> |
|||||
1st session |
Discussion and brief presentation in class about project -> Memo | |||||
for 2nd session 8-10 min per team (absolute maximum 12) |
Now suppose you deliver the final presentation in front of the management of the Kunsthalle. Tell them about the project and what you did Data analysis: Describe the ... + socio-demographic characteristics of the respondents + describe the metric variables and analyse correlations that may make sense (including Inhabit_sqKm and distance) All Groups: define management dilemas and => Management / Research Questions for your topic ! |
... origin of the visitors and their socio-demographic characteristics for the different groups (question 26 ff in last colum) (multivariate analysis: use pivot-tables to analyse your variable (mean / percentage) broken down by two dimensions) |
... Inducement to visit the exhibition (question 1) and their socio-demographic characteristics for the different groups (multivariate analysis: use pivot-tables to analyse your variable (mean / percentage) broken down by two dimensions) |
... exhibition = reason to visit Bremen (question 3) and their socio-demographic characteristics for the different groups (these are only the out-of-town visitors) (multivariate analysis: use pivot-tables to analyse your variable (mean / percentage) broken down by two dimensions) |
... Motivation to visit the exhibition (question 17) and their socio-demographic characteristics for the different groups (multivariate analysis: use pivot-tables to analyse your variable (mean / percentage) broken down by two dimensions) |
... Media (question 15 - only the yes/no-answers, not the texts) and their socio-demographic characteristics for the different groups (multivariate analysis: use pivot-tables to analyse your variable (mean / percentage) broken down by two dimensions) |
| in
class: 10 March |
"College Town": All groups should
perform |
(a) price / quantity | (b) advertising expenditures / quantity | (c) distance / quantity | (d) distance / advertising expenditures | (e) price / distance |
| 10 March | CollegeTownQuestion.doc, College_Town.xls (ii) the multiple regression, answering ... |
(j) what happens if FCI increases the rent by 100 and
advertising by 20 + general recommendations |
(i) what happens if FCI decreases the rent by 50 + general recommendations |
(h) what happens if FCI increases the rent by 50 and advertising
by 10 + general recommendations |
(g) what happens if an appartment building is located
5 miles further away than the average distance + general recommendations |
(f) what happens if FCI increases the advertising by 10
+ general recommendations |
| 10 March (practicing for the midterm) |
Example
test + individual teams --> |
1 | 2.2 | 2.3 | 2.4 | 4.1 |
| (t.b.a.) | please read the papers and deliver a very brief
summary of the research question and results
in class: - do NOT spend more than 30-45 minutes to read the paper !!! - presentation should be 5-10 minutes |
2) A hedonic analysis of American collectable comic-book prices |
3) Cinema Demand in Germany | 4) Bremen Happiness Index | (select one of the other 4) |