![]()
Economics & Statistics
Springterm 2024
Springterm 2024 |
Quantitative
Methods
(MBA module "Business Environment") - Summer
Term 2024
|
Basic Material / Links:
additional books:
Alternatively you might want to have a look at (free) ebooks, for example at: http://bookboon.com/en/statistics-and-mathematics-ebooks e.g.: http://bookboon.com/en/applied-statistics-ebook, ... |
|
|
Assessment:
Learning Portfolio
|
 |
sess. |
date / time | Research Methods (Theory: Cooper et. al.) | Quantitative Methods (Koop and also “Quick Study” Statistics Overview) | Material / case (practical work on cases - see also table below) |
1 |
Fr, 03.05.24 18:00 | General Introduction
(Welcome.ppt) -> Why Research Methods (MindMap)? Part I: Introduction
to Business Research |
Preparing Data: “Statistics-QuickStudy”
Statistics Overview
|
- Course
Material (reader) - Our Memo
about the case study: visitors' survey in a museum: Videos: data handling
& analysis in Excel in my YouTube
channel (.avi) |
2 |
Sa, 04.05.24 15:00 !! -16:30 |
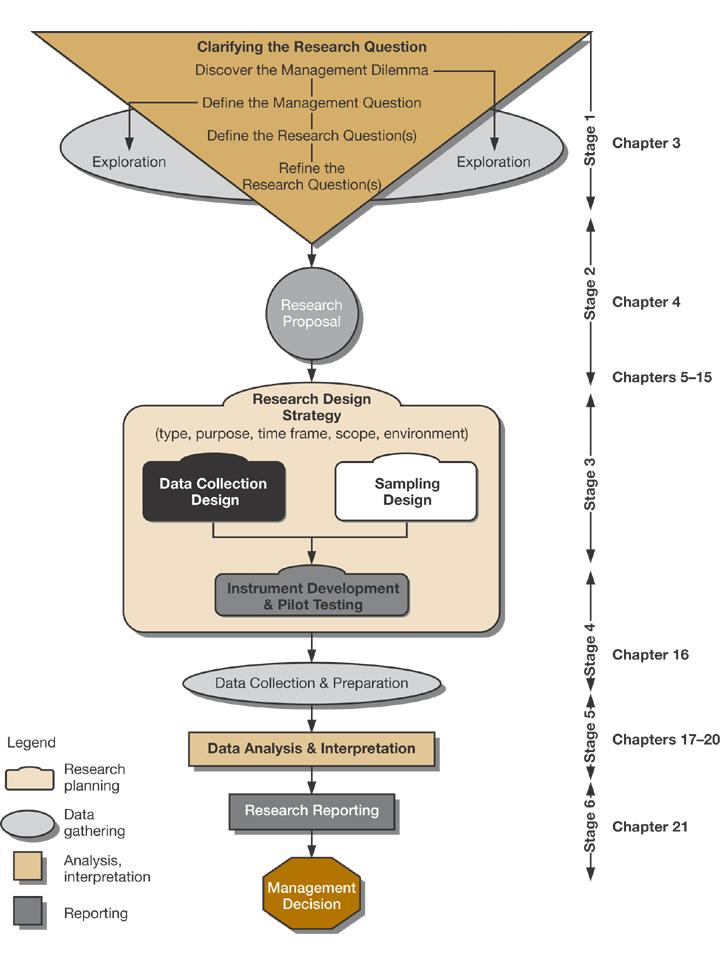
3. The Research Process
Please prepare the team house-work - see table below |
Correlation
and regression analysis Koop:
"Analysis of Economic Data" (3) (correlation) (reader pp. 35 ff)
(4) An introduction to simple regression |
Correlations and
Causes: (source: http://en.wikipedia.org/wiki/Correlation_does_not_imply_causation) |
3 |
Sa 25.05.24 13:15 | 1) house-work - see table below
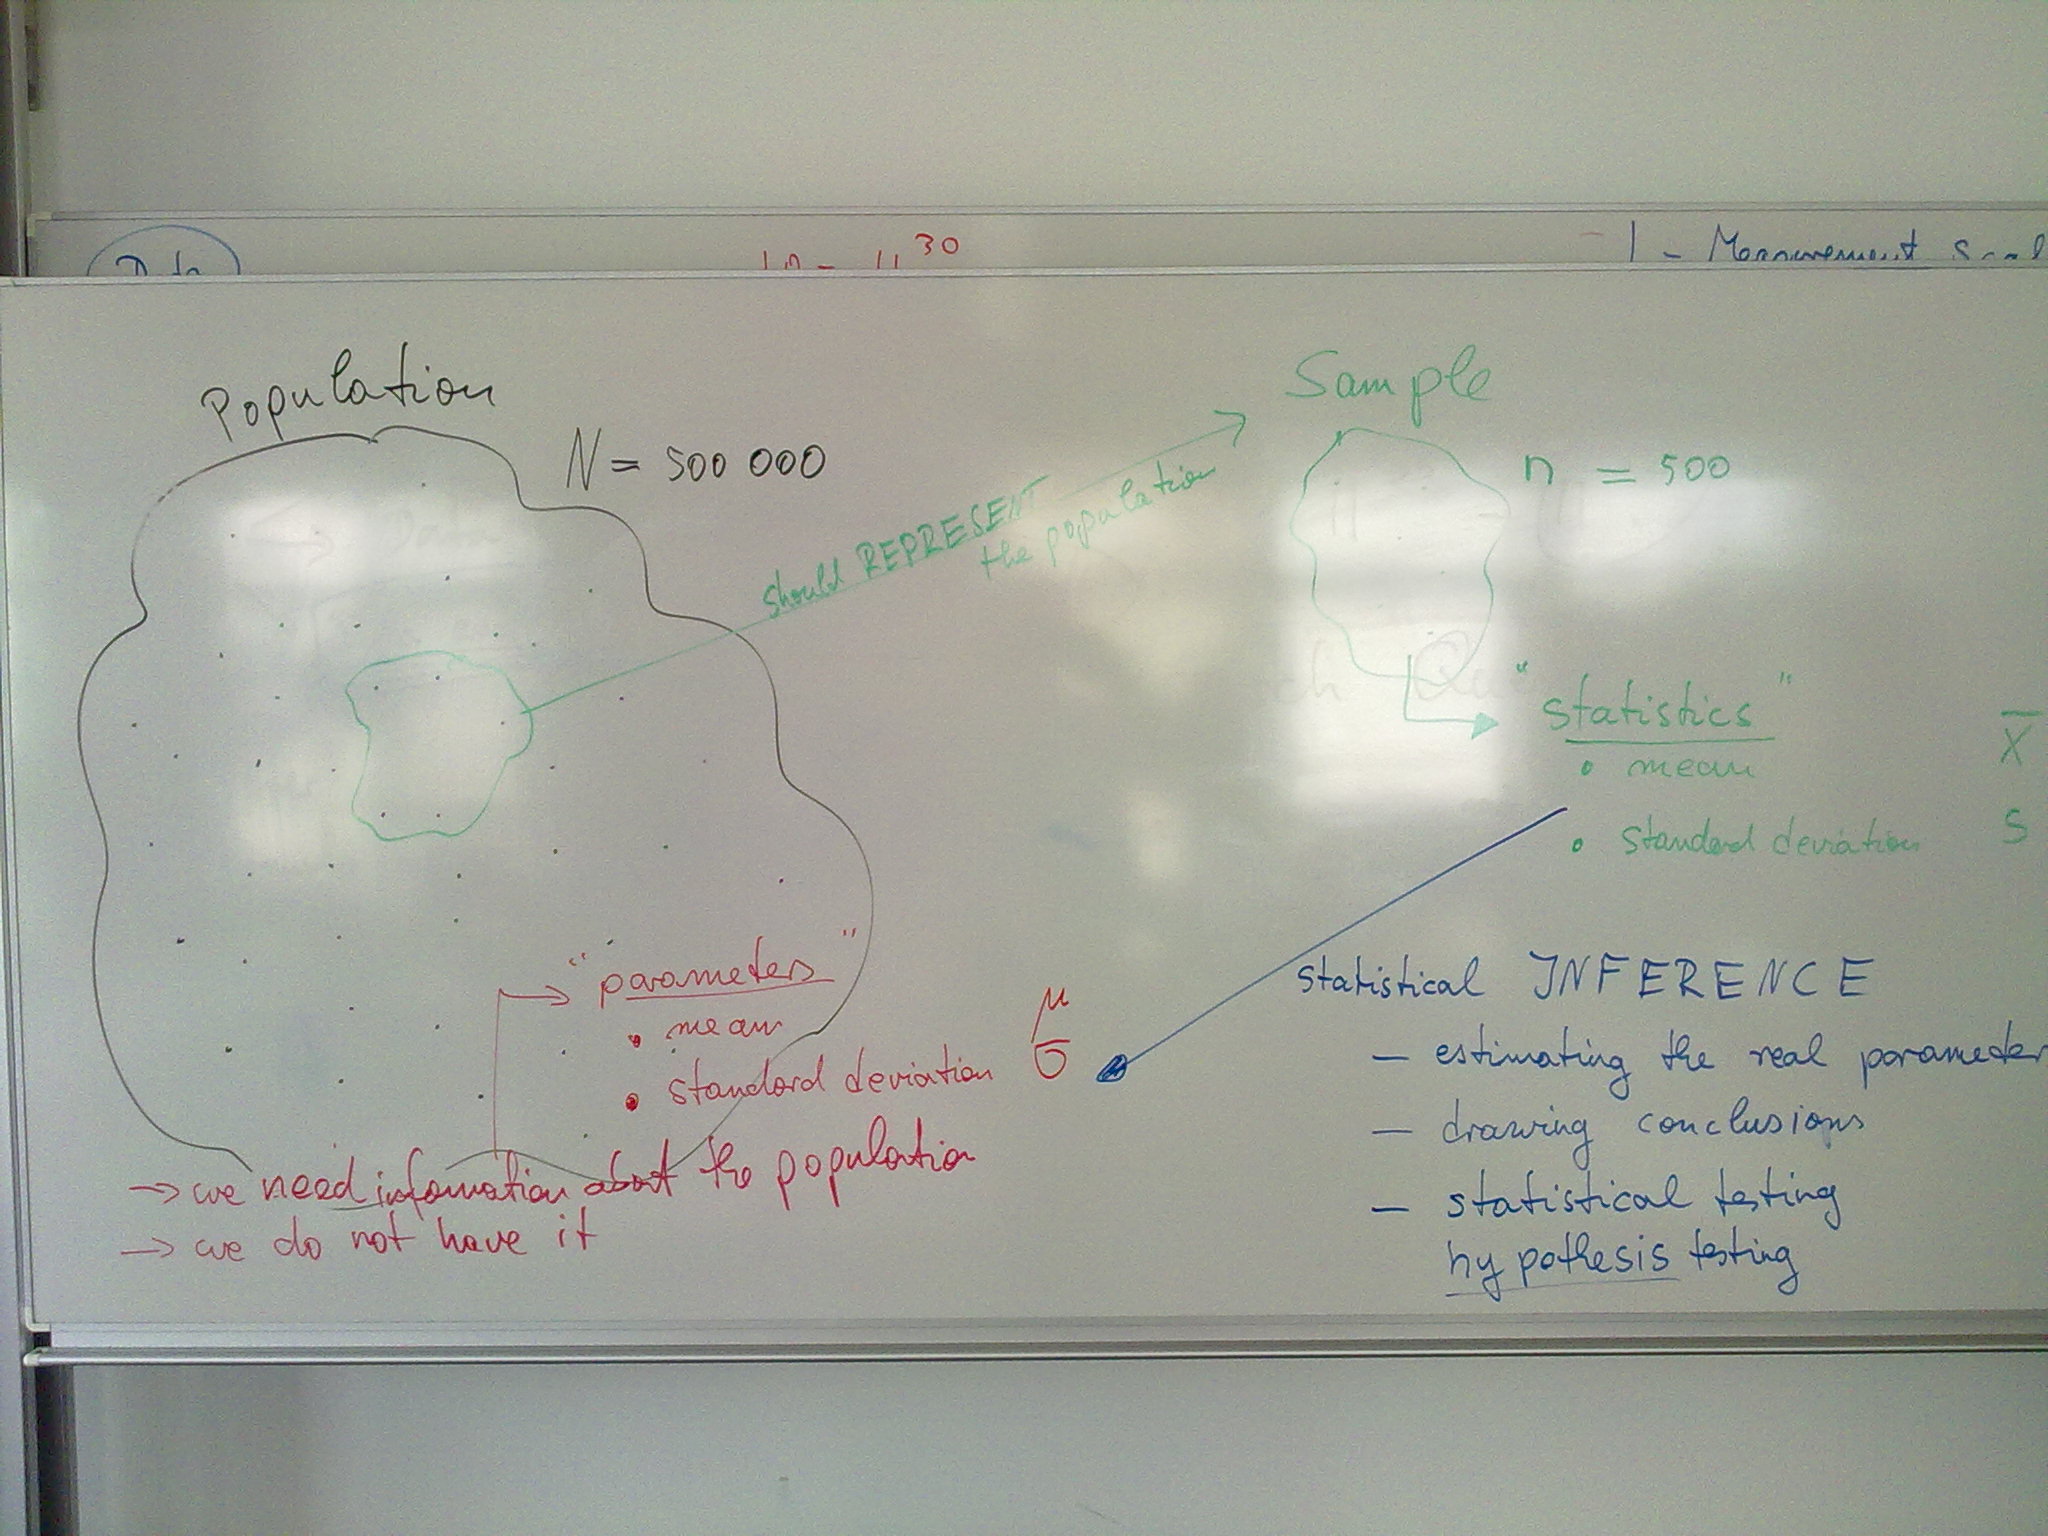
Statistical
Inference: Population and sample
|
Correlation
and regression analysis (3) (correlation) (reader pp. 35 ff)
Koop: "Analysis of Economic Data" (4) An introduction
to simple regression Causality,
Specifications and Applications |
Please download the XL-files by Koop (zip), we are going to use (some of) them in class. Today we will use especially: Forest.xls and HPrice.xls - College Town: students' results for simple linear analysis (see tasks in the table below) -> Material/resmeth/CollegeTownQuestion.doc, College_Town.xls -
Hedonic regression for used cars Sample application:
Firm Foundations in Bremen: |
4 |
Sa 22.06.24 13:15 | Teams
present proposals for the final presentations!
***
Evaluation *** Statistical
Inference: Population and sample
|
XL-files by Koop (zip), we are going to use (some of) them in class. Today we will use especially HPrice.xls (7) Regression
with dummy variables New Chapter
8 Qualitative Choice Models in 4 th edition (p119) Statistical
software (examples): |
Some
example papers: Using SPSS
Review and conclusion + YOUR questions |
Pres. |
Sa 29.06.24 13:15 | Teams' presentations The
presentation time should be approx. 5-10 minutes per student ~> max
30 minutes per team. You
are expected to tell a story about your topic: It is expected that you initiate and moderate a discussion about the topic and your findings. So it is strongly recommended that you prepare a discussion question/s. The discussion time doesn't count into the presentation time. |
Thank you for uploading the presentations and handouts in Aulis up to Friday 28 June 2024 6 p.m.!
Please
note the:
|
Don't forget to use - and quote correctly - academic literature, especially articles from academic journals. To
be found in a library database (for example Selected
Resources - Faculty 1: International Business at TB
Economics and Nautical Sciences at SUUB
Bremen). For more information about finding and managing literature see below -> |
House-Teamwork: The teams are asked to prepare their tasks and present them in class.
| Date \ Group: | All |
Alfa |
Bravo |
Charlie |
Delta |
Teams: --> |
Alexander, Angela, Vladyslaw | Inken, Kira, Sosa | Mary, Partha | ||
1st session |
Discussion and brief presentation in class about project -> Memo | ||||
Please
PREPARE the solution process for 3rd
session 7 to 10 min. per team !!! |
Now it's the big day: You've spent the last 5 weeks analysing the data for the museum and today you present your results to the management of your customer: Introduction: we are ... All Groups: define management dilemas and => Management / Research Questions for your topic ! |
... origin of the visitors and their socio-demographic characteristics for the different groups (question 26 ff in last colum) including multivariate analysis: use pivot-tables to analyse your variable (mean / percentage) broken down by two dimensions) |
... Inducement to visit the exhibition (question 1) and their socio-demographic characteristics for the different groups including multivariate analysis: use pivot-tables to analyse your variable (mean / percentage) broken down by two dimensions) |
... Reason to visit the exhibition (question 3) and their socio-demographic characteristics for the different groups (these are only the out-of-town visitors) including multivariate analysis: use pivot-tables to analyse your variable (mean / percentage) broken down by two dimensions) |
... Motivation to visit the exhibition (question 17) and their socio-demographic characteristics for the different groups including multivariate analysis: use pivot-tables to analyse your variable (mean / percentage) broken down by two dimensions) |
To be used IN class in 3. session |
"College Town": All groups should perform
|
(a) price / quantity | (b) advertising expenditures / quantity | (c) distance / quantity | (d) distance / advertising expenditures |
| - " - | CollegeTownQuestion.doc, College_Town.xls (ii) the multiple regression, answering ... |
(j) what happens if FCI increases the rent by 100 and
advertising by 20 + general recommendations |
(i) what happens if FCI decreases the rent by 50 + general recommendations |
(h) what happens if FCI increases the rent by 50 and advertising
by 10 + general recommendations |
(g) what happens if an appartment building is located
5 miles further away than the average distance + general recommendations |
| (t.b.a.) | please read the papers and deliver a very brief
summary of the research question and results
in class: - do NOT spend more than 30-45 minutes to read the paper !!! - presentation should be 5-10 minutes |
2) A hedonic analysis of American collectable comic-book prices |
3) Cinema Demand in Germany | 4) Bremen Happiness Index |
Literatur Research:
Possibilities of the University Library: Econmics & Business Studies, Selected Resources - Faculty 1: International Business, Data Bases and Zotero
- EconLit
-> EconBiz.de
-- Find Economic Literature (Service of ZBW)
- Research skills:
- Guided Walk -
Video-Course -
Academic-Career-Kit -
Guides:
+ "Write your best paper" – a
guide to academic writing
for economics and business
students (PDF-Guide)
+ Guidelines: Search
and Evaluate Scholarly Literature
+ Guidelines: Citation
(APA style) [pdf; 280 KB]
- OECD
iLibrary: http://www.oecd-ilibrary.org/
- Web of Science: http://isiknowledge.com/wos
Literature
Management System -> ZOTERO
- Zotero at SUuB,
our library
- Links Link
Uni Bremen, Studytools
- Quick start guide
- Zotero Tutorial
(video) Important: -> please
install the Zotero app and the Zotero Connector for your browser !!
Some Potential Data Sources:
ECB
EC
OECD
World Bank
IMF
WTO
UNCTAD
CIA
Index Mundi
FRED
Data Market
Telegraph
US Energy Administration
BBC
International Property Prices
Worldwide Tax
Statistisches Bundesamt Deutschland
Deutsche Bank Research
Statistical Bureau of the European Commission
Journals
Blogs